|
Event driven email notifications 
|
 |
|
|
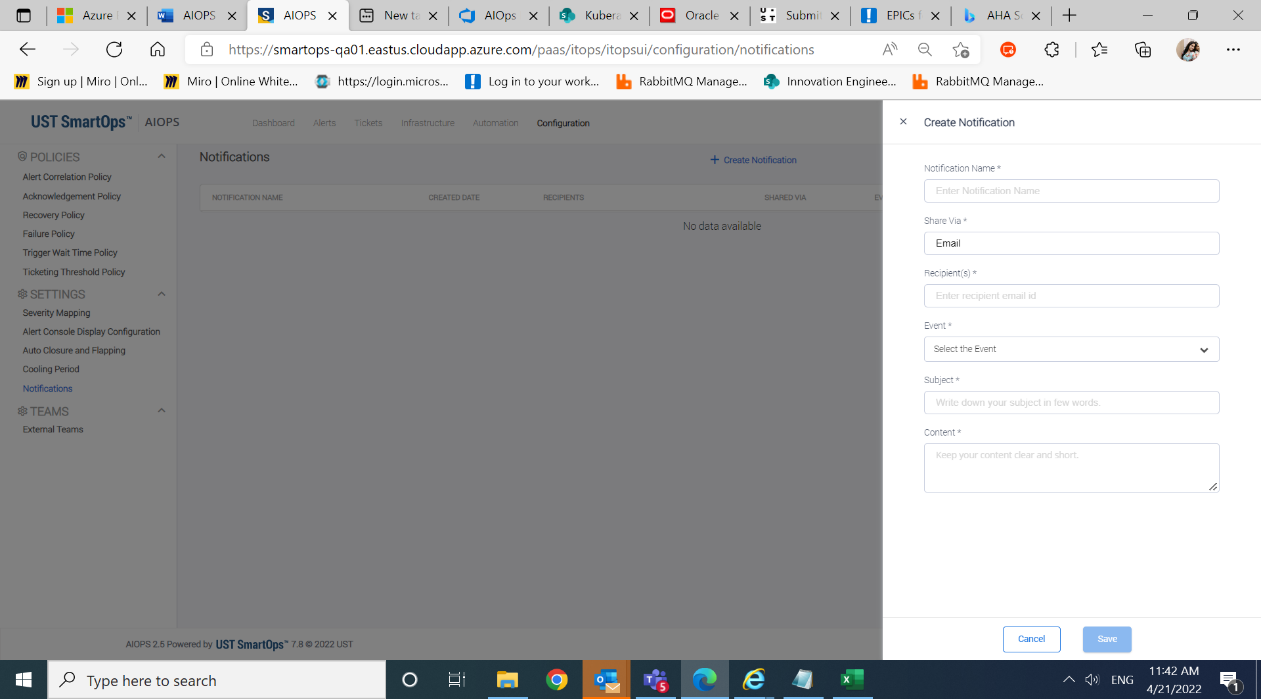
Introducing a generic framework for event-based notification within AIOps. Users will now be able to send email notifications during events such as ticket is created, cluster is acknowledged by user, etc.
Events for which email notification can be configured
- When ticket created for alert cluster
- When ticket created from acknowledgement alert cluster
- When ticket created manually
- When an alert cluster is acknowledged by the user
- When surge ticket is created
|
Introducing Maintenance Window & Cooling Period
|
|
|
|
Maintenance mode value ('ON' & 'OFF') will not be explicitly set by the user anymore. From this release, the user can define maintenance window for scheduled downtimes. After the maintenance window ends, a cooling period can be scheduled to define how long the device will require to be back to normal operation.
Cooling window can be set up at the project level and is an optional setting.

Maintenance window can be scheduled in bulk using the device inventory upload. For individual devices, the maintenance schedule can be updated via device details screen.
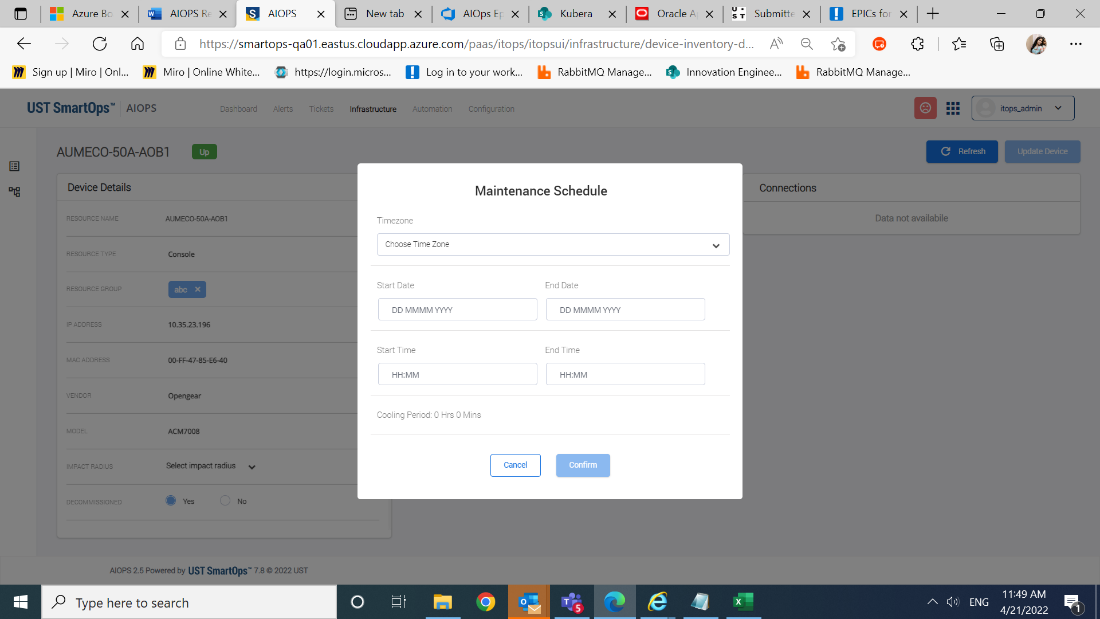
With this change, the API for updating maintenance mode ‘/updateDeviceMaintenanceStatus’ should not be used and will soon be decommissioned.
|
Device status based on failure and recovery alerts
|
|
|
|
The failure policy determines if an alert is a failure alert or not. The recovery policy will determine if an alert is a recovery alert or not. Device status will be determined by the absence/presence of failure alerts and matching recovery alerts for a device. In this context, matching refers to an exact match between the node name and alert metric of the failure and recovery alert.
Device status becomes UP when
- All cluster(s) with failure alert(s) for a device is closed via auto closure or user actions or reverse sync (as existing).
- For every open failure alert on the device, a recovery alert with the same alert metric is received with alert created time >= alert created time of the failure alert.
- When there is a single matching recovery alert corresponding to multiple open failure alerts
Device status becomes DOWN when
- On receiving a new failure alert, the device status will be updated to DOWN only when there is no matching recovery alert available with alert created time > = alert created time of the new failure alert
| Sample Scenarios |
Device Status |
| 1 FAIL alert is in unclosed cluster: no matching REC alerts |
DOWN |
| 1 FAIL alert is in unclosed cluster: at least 1 matching REC alert in any cluster |
UP |
| 2 FAIL alerts in unclosed cluster: 1 matching REC alert in any cluster (matches both FAIL alerts) |
UP |
| 2 FAIL alerts in unclosed cluster: 2 matching REC alerts in any cluster (matches FAIL alerts separately) |
UP |
| 2 FAIL alerts in unclosed cluster: 2 REC alerts in any cluster (matches only 1 FAIL alert) |
DOWN |
|
Set up display time zone based on user preference
|
|
|
|
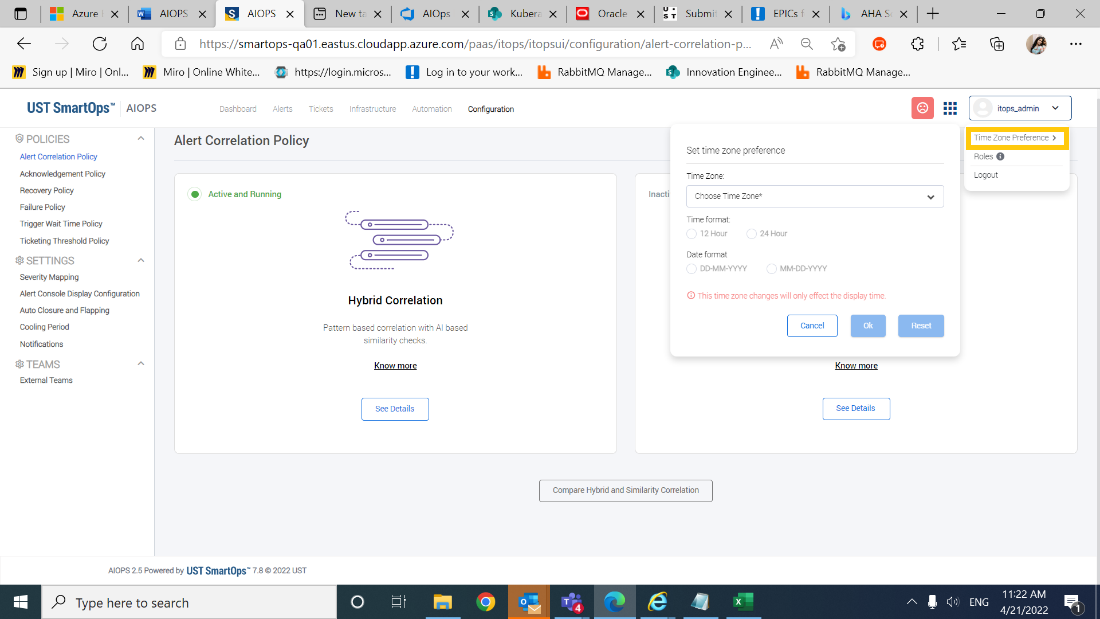
Users will now be able to set up their individual preferred time zone and format to be used for time fields displayed on screen. This will be useful for remote ITOps teams working in a different time zone than their customers.
You'll see this setting in effect on all time fields in all these areas:
- Alert/Ticket listing
- Configuration screens
- Automation
- Alert Download
The only exception will be the Grafana based dashboards, which will continue to show the local browser time.
|
Customized Ticket Threshold using rules 
|
|
|
|
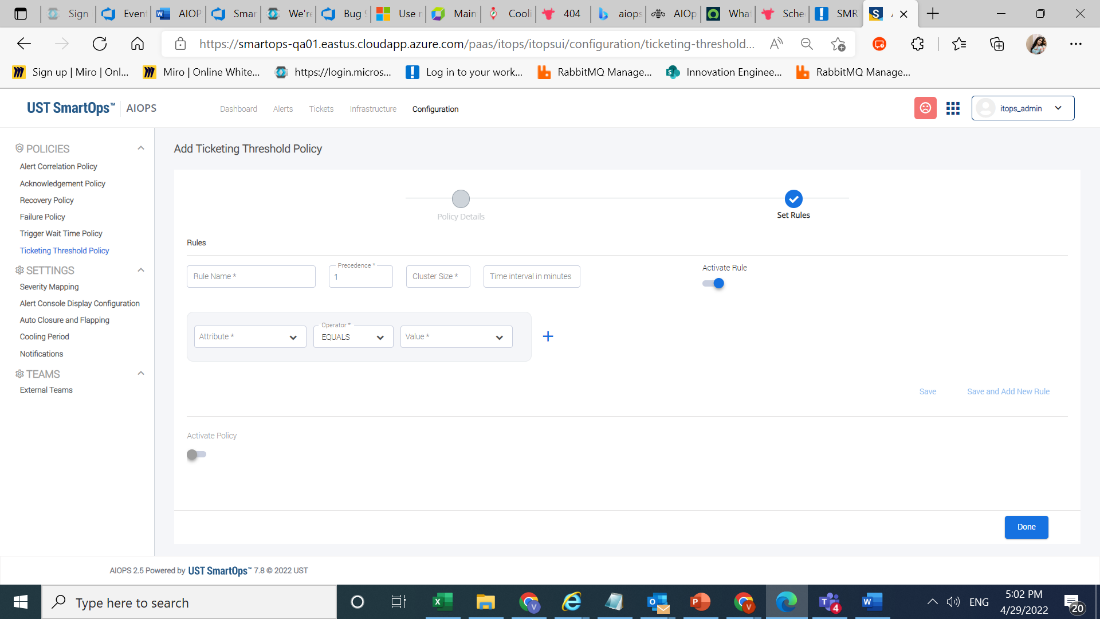
Ticket Threshold configuration is now customizable using policies and rules. This will allow admins to set different thresholds based on alert attributes. For example, admin can set up different thresholds for different types of alerts such as server alert, warning alert originating from same/different source.
|
Remove restriction on permitting only allowed fields in Ticket Templates
|
|
|
|
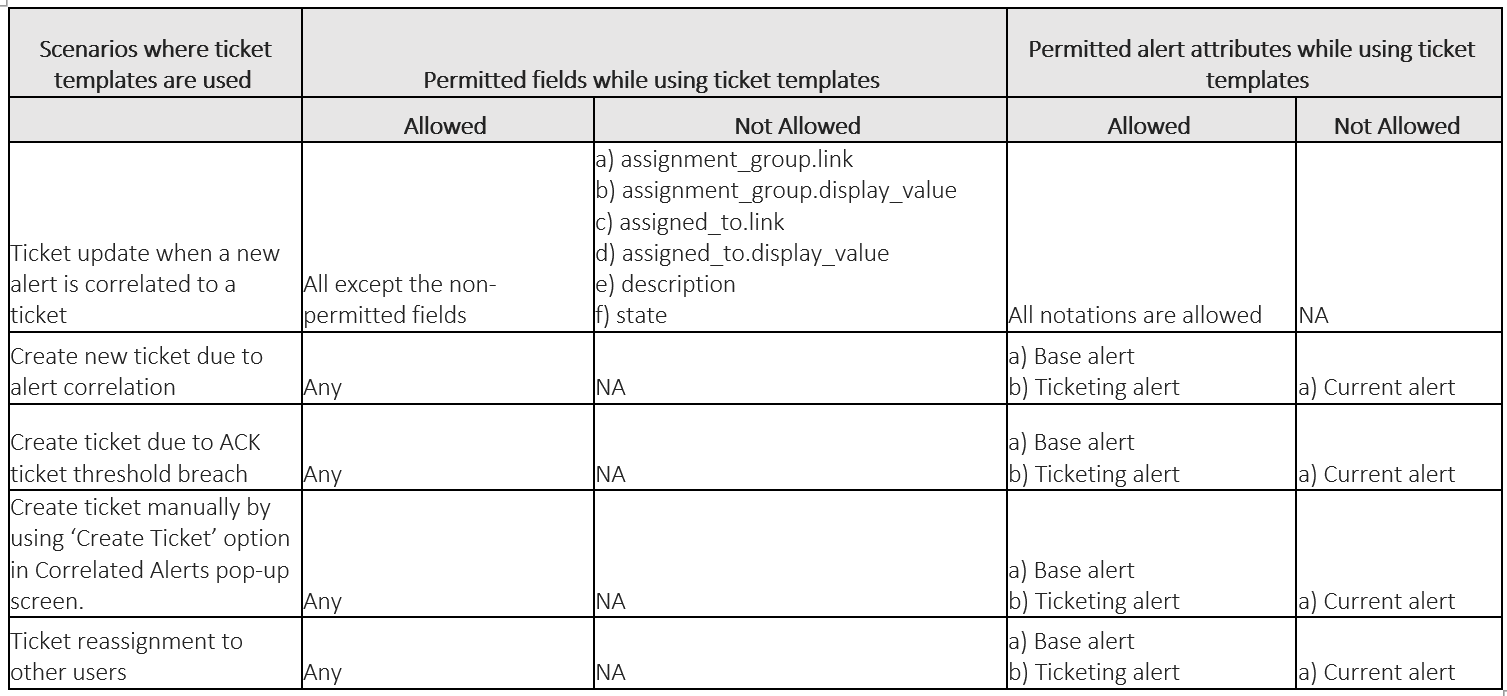
From this release onwards users can use any fields except the not allowed ones in the ticket templates.
|
Reverse sync of re-opened tickets from ITSM
|
|
|
|
From this release, when ticket gets re-opened in ITSM, it will be synced back to AIOps. AIOps will change the ticket status to Open and make it available for correlation.
|